Diversity in Jenks: What Does It Look Like in Our AP Classes?

By Charisma Ganye
As you walk the halls of the high school,you see a variety of people. People filled to the brim with stories and anecdotes. The halls show you one perception of Jenks. Step into the classrooms, AP classrooms specifically, you can get a completely different perception of the school. SImply put, if you walked into an AP classroom you would most likely assume the school is more predominantly white than it actually is.
As someone who has taken numerous AP classes, and often has the same people in those classes regardless of subject or year in school, I wanted to see what was up. I don’t have answers to why any of this is the way it is, but I do have speculations. And because of those speculations, a survey needed to be conducted.
First up, a look into the whole high school’s demographics.

How to read this data: the left column- the 6%, 13%, 14%, 7%, 53% and 7%- reflects the demographics of Jenks High School. The right column- the 14%, 2%, 17%, 9%, 49% and 9%, reflects the typical level in a school in Oklahoma.
How I interpreted the data: the increase in the percentage of not only the white people but especially Asian people in the school causes all other races to suffer at least a little with some having a much larger discrepancy from the state average than others.
Remember these when looking at the survey’s results!
My speculations based on what I have experienced in classes:
- More than half of the participants will be white
- The second largest group will be Asian
- All other groups will be far less than percentage they are in the overalls school demographic
The results:
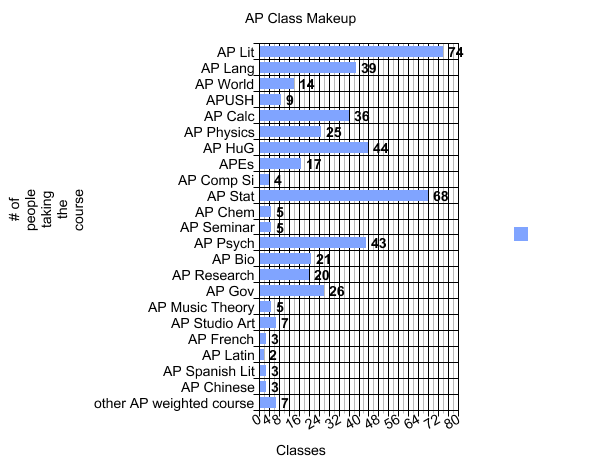
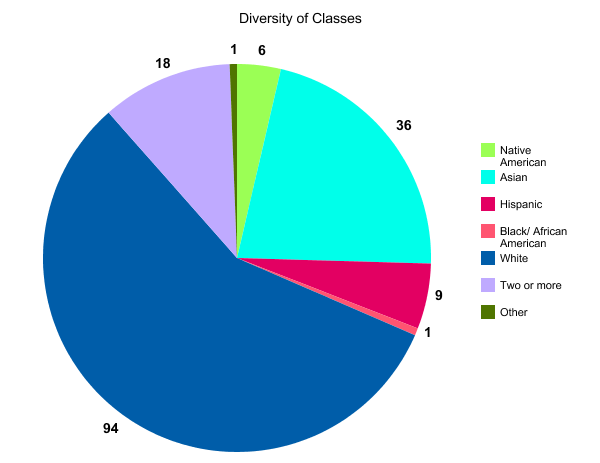
How to read this data: the 165 who completed the survey span across 22+ classes which aren’t even all that the school provides. The demographics of the sample I got is 3.6% (6) are Native American, 21.8% (36) are Asian, 5.5% (9) are Hispanic, 0.6% (1) are African American, 56.7% (94) are White, 10.9% (18) are two or more races and 0.6% (1) identify as something not listed.
There’s no one way to interpret the data and one’s interpretation may end up being completely different than mine. My interpretation of it is that people who are White and Asian make up so much of the school that it makes them completely dominate AP classes. This in turn makes all the other groups lessen in size. One of the few things that still is astounding to me is that even though there are more than 22 classes that are part of the survey, only 1, literally 1 person who took it was black. The thing is, it’s also not at all surprising to me seeing as that in the 6 AP classes I took before this year, there has been 1 black person in 1 of the classes, AP Lang to be specific.
Keep in mind, this is all speculative. I don’t have the answers to why this is the way it is nor do I think anyone does. This was done purely because I was curious about the numbers and wanted to figure at least a little something out. All I can really say is that this is a work in progress. These numbers aren't everything and it's important to keep that in mind.